



Few money decisions stir up as much emotion as this one. One side says renting is throwing money away. The other side says buying a home is a trap that drains your savings. Both sides are partly right, and neither can tell you what to do with your own money. The answer comes down to one number: how many years you will stay in the home.
This guide shows you how to find that number yourself. You will see the real monthly cost of each path, a full worked example, and a step-by-step method you can repeat with a rent vs. buy calculator using your own price, rent, and rate.
Quick Answer: How Long Must You Stay for Buying to Win?
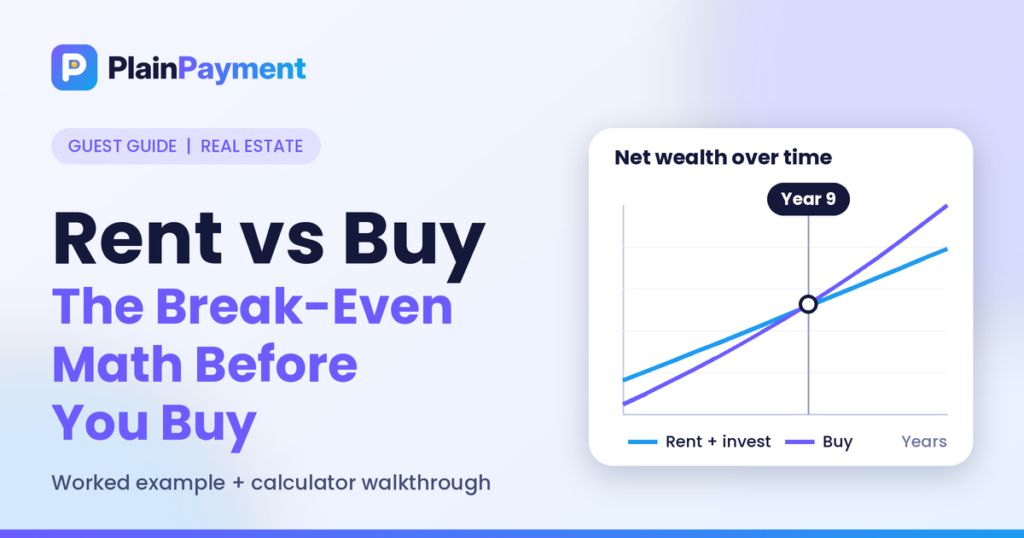
For a typical U.S. scenario, buying tends to beat renting only after a stretch of several years. In the worked example below, a $400,000 home against $2,200 monthly rent breaks even in year 9. Before that point, renting and investing the difference comes out ahead. After it, buying pulls away.
Your break-even year could be sooner or later. It depends on your mortgage rate, home price growth, rent increases, closing costs, and what your savings could earn elsewhere. Treat the example as a method, not a promise.
What Break-Even Means in a Rent vs Buy Decision
The break-even point is the length of stay at which the total cost of owning equals the total cost of renting. Stay shorter and renting wins. Stay longer and owning wins.
Break-even exists because buying front-loads costs. You pay a down payment and closing costs on day one. You also pay selling costs when you leave. Those costs are spread over your years in the home, so a short stay carries the full weight of them and a long stay dilutes them.
A fair comparison needs both sides to start with the same cash. If you buy, your cash goes into the house. If you rent, that same cash can go into an investment account. Comparing the two outcomes at the end is what makes the math honest.
The Real Monthly Cost of Owning vs Renting
The most common mistake is comparing rent to the mortgage payment alone. A mortgage payment covers only principal and interest. Owners also pay for property tax, insurance, and repairs. Here is a first-year snapshot for a $400,000 home with 20% down and a 6.5% fixed rate:
| Monthly cost | Owning | Renting |
|---|---|---|
| Mortgage principal and interest | $2,023 | n/a |
| Property tax (1.1% of value) | $367 | n/a |
| Homeowners insurance | $150 | n/a |
| Maintenance (1% of value per year) | $333 | n/a |
| Rent | n/a | $2,200 |
| Renter’s insurance | n/a | $15 |
| Total | $2,873 | $2,215 |
In year one, owning costs about $658 more per month. That gap matters, because a renter who invests it can build a portfolio while the owner builds equity.
Not every dollar of owning is a loss, though. Part of each mortgage payment reduces your loan balance, and your home may gain value over time. The question is whether those gains outrun the extra cash you put in.
Why Early Mortgage Payments Build Equity Slowly
On a 30-year loan, the first years are heavy on interest. On a $320,000 loan at 6.5%, you would pay about $121,400 over the first five years. Only about $20,400 of that reduces the balance. The rest is interest.
That is why a short stay rarely pays off. You have borrowed a lot, paid mostly interest, and then you must pay selling costs on top.
Step-by-Step: How to Calculate Your Rent vs Buy Break-Even
Follow these steps in order. You can do them on paper or in a spreadsheet.
- Set your purchase price, down payment, and expected closing costs. Closing costs on a purchase often run around 2% to 5% of the price.
- Find your loan amount by subtracting the down payment from the price.
- Calculate the monthly principal and interest with a mortgage payment calculator, using a rate from a real quote.
- Add monthly property tax, insurance, and a maintenance budget. A common planning figure for maintenance is 1% of the home’s value per year.
- Add HOA dues if they apply.
- List your rent, your expected yearly rent increase, and renter’s insurance.
- Pick a growth rate for home prices and a return rate for money you would invest if you rented.
- Track both paths year by year. For the owner, subtract the remaining loan balance and selling costs from the home’s value. For the renter, add up the invested cash plus any monthly savings.
- Compare the two totals each year. The first year when the owner’s total is higher is your break-even year.
Worked Example: $400,000 Home vs $2,200 Rent
Here are the assumptions used in this example. They are illustrations, not forecasts.
- Home price: $400,000
- Down payment: 20% ($80,000)
- Closing costs when buying: 3% ($12,000)
- Mortgage: 30-year fixed at 6.5%, payment of $2,023 for principal and interest
- Property tax: 1.1% of home value per year
- Homeowners insurance: $1,800 per year, rising 3% yearly
- Maintenance: 1% of home value per year
- Home appreciation: 3% per year
- Selling costs: 6% of the sale price
- Rent: $2,200 per month, rising 3% yearly, plus $15 renter’s insurance
- Renter’s investment return: 5% per year on the starting $92,000 and on any monthly savings
- Tax benefits and inflation effects: ignored to keep the comparison simple
The buyer’s number is home value minus loan balance minus selling costs. The renter’s number is the invested portfolio. Here is how they compare:
| Years in home | Buyer’s net wealth | Renter’s portfolio | Who is ahead |
|---|---|---|---|
| 3 | $102,330 | $130,413 | Renting by $28,083 |
| 5 | $136,332 | $156,633 | Renting by $20,301 |
| 7 | $173,101 | $183,247 | Renting by $10,146 |
| 8 | $192,604 | $196,671 | Renting by $4,067 |
| 9 | $212,901 | $210,156 | Buying by $2,745 |
| 10 | $234,029 | $223,685 | Buying by $10,344 |
| 15 | $353,606 | $291,786 | Buying by $61,820 |
The break-even lands in year 9. By year 15, the owner is about $62,000 ahead. If you move after three years, the renter is ahead by roughly $28,000. The same home and the same rent give opposite answers depending only on how long you stay.
Why Renting Wins in the Early Years
Three forces hold the buyer back at first:
- Upfront cash. The $92,000 you spend on the down payment and closing costs cannot earn a return elsewhere.
- Selling costs. At a 6% rate, a sale in year five on a $463,710 home would cost about $27,800.
- Interest-heavy payments. Little of your early payment builds equity.
These costs hit hardest in short stays. If there is a real chance you will relocate for work or family within five years, that risk belongs in your math.
Why Buying Pulls Ahead Later
Time flips three of those forces in the owner’s favor:
- Rent keeps rising. In the example, rent grows from $2,200 to about $3,300 by year 15. A fixed-rate mortgage payment does not change.
- Principal paydown speeds up. Each year a larger share of your payment reduces the balance.
- Appreciation compounds. A home that grows 3% a year gains more dollars in year 12 than in year 2.
After the break-even year, the owner’s advantage tends to widen. Property tax, insurance, and maintenance still rise, but the fixed mortgage payment keeps the core housing cost steady.
A 30-Second Shortcut: The Price-to-Rent Ratio
If you want a quick screen before building a full model, divide the home price by one year of rent. For the example, that is $400,000 divided by $26,400, or about 15.2.
People often use this rule of thumb:
| Price-to-rent ratio | What it often suggests |
|---|---|
| Below 15 | Buying is often favored |
| 15 to 20 | A toss-up that depends on your stay |
| Above 20 | Renting is often favored |
The ratio ignores your mortgage rate, your taxes, and how long you will stay. Use it to decide whether the full math is worth doing, not to make the final call. The example above sits at the lower edge of the toss-up range, which matches a break-even of about nine years.
What Moves the Break-Even Point the Most
Change one input at a time and watch what happens. These variables have the largest effect:
- Length of stay. This is the biggest driver. Each extra year dilutes closing and selling costs.
- Mortgage rate. A higher rate raises interest cost and pushes break-even later. A lower rate pulls it earlier.
- Home price growth. Faster appreciation helps the buyer. Flat prices can push break-even out by many years.
- Rent growth. Faster rent increases help the buyer. Rent control or flat rents help the renter.
- Down payment size. A bigger down payment cuts interest but ties up more cash that could be invested.
- Investment return. A higher assumed return makes renting look better. This is the least predictable input, so test a range.
- Closing and selling costs. Lower fees help the buyer, especially in shorter stays.
- Maintenance. An older home may need more than 1% per year. A newer one may need less.
Test each of these as a low, middle, and high case. If buying wins in all three, you can be more confident. If the answer flips, your decision is sensitive and deserves extra thought.
Calculator Walkthrough: Entering Your Numbers
A good calculator does the year-by-year work for you. Gather these inputs first:
| Input | What to enter | Where to find it |
|---|---|---|
| Home price | The price you expect to pay | Listings or a pre-approval |
| Down payment | Cash you will put down | Your savings plan |
| Mortgage rate | A rate from a real quote | A lender’s loan estimate |
| Loan term | 15, 20, or 30 years | Your loan options |
| Property tax | Yearly tax or a percent of value | County records or the listing |
| Insurance | Yearly premium | An insurance quote |
| Monthly rent | Rent for a comparable home | Local listings |
| Rent increase | Expected yearly change | Your lease history |
| Home appreciation | A cautious yearly estimate | Long-run local trends |
| Years you will stay | Your honest estimate | Your career and family plans |
Once the results appear, do not stop at the headline. Look at four things:
- The break-even year, which tells you how long you need to stay.
- The total cost of each path at your expected stay.
- How the result changes when you shorten the stay by two years.
- How the result changes when appreciation is lower than you hoped.
A purchase that only wins under optimistic assumptions is a risky purchase. Pick inputs you could defend to a skeptical friend.
Can You Afford to Buy at All?
Break-even tells you whether buying is cheaper over time. It does not tell you whether you can handle the payment today. Lenders often look for housing costs under about 28% of gross income and total debts under about 36%. Use a mortgage affordability calculator to see which price range fits your income and debts.
For a deeper walkthrough of the percentages and why the maximum approval is often too high, read how much house you can afford. Being approved for a loan is not the same as having a comfortable budget.
What If You Rent and Invest the Difference?
The renter’s side of the math only works if the renter actually invests. Imagine you rent and invest the $92,000 upfront cash plus about $658 a month. That money compounds over time, and a compound interest calculator shows how fast a balance grows when returns earn returns of their own.
Be honest about your habits. If saving the difference is unlikely, the renter’s column in the table will not match your real life. Owning acts as forced savings for many people, because the mortgage payment is automatic. That is a behavioral benefit, not a mathematical one, but it can be real.
Costs People Forget
These often break a home budget even when the break-even math looks good:
- Emergency repairs. A roof, a water heater, or an HVAC system can cost thousands at once.
- Rising insurance and tax. Both can increase faster than your income.
- HOA fees and special assessments. Condos and planned communities can raise dues or add one-time charges.
- Moving and setup costs. Furniture, window coverings, and a lawn mower add up quickly.
- Private mortgage insurance. With less than 20% down on a conventional loan, you may pay this until you build more equity.
On the renting side, remember rent increases at renewal, moving costs between rentals, and the chance that a landlord sells or raises the price.
Non-Financial Factors That Still Matter
Money is only part of the decision. Consider these as well:
- Flexibility. Renting lets you move with a few months of notice. Selling a home takes time and money.
- Control. Owners can renovate, keep pets, and stay as long as they want. Renters follow lease rules.
- Stability. A fixed-rate mortgage protects you from rent hikes. A long lease can protect renters for a year or two.
- Time and effort. Owners handle repairs and maintenance. Renters call a landlord.
- Local market. In some cities, buying costs far more than renting. In others, it costs less.
A path that is slightly more expensive but fits your life may still be the better choice.
Quick Decision Checklist
Buying usually makes more sense when most of these are true:
- You expect to stay at least as long as your break-even year.
- You have emergency savings left after the down payment and closing costs.
- Your housing cost stays comfortable if rates, taxes, or insurance rise.
- Your job and family plans are stable.
- Your price-to-rent ratio is near or below 15.
Renting usually makes more sense when most of these are true:
- You may move within a few years.
- You would be stretched thin by the down payment or monthly cost.
- You will invest the difference consistently.
- Local prices are high compared with rents.
- You want flexibility more than long-term equity.
Bottom Line
The rent vs buy decision is not about which option is better in general. It is about which option is better for your price, your rent, your rate, and your time horizon. In the example here, buying needed about nine years to overtake renting. A different market or a different rate could move that number up or down by years.
Run the break-even for your own situation, test a cautious case and an optimistic case, and keep a cash cushion either way. The estimates in this article are for education and are not financial advice. For a decision this large, talk with a licensed lender or financial professional who can review your full picture.
FAQs
Is it better to rent or buy a home right now?
It depends on your local price-to-rent ratio, your mortgage rate, and how long you will stay. In expensive markets with high rates, renting often wins for stays under several years. In markets where rents are high compared with prices, buying can win sooner.
How long do you have to stay in a house to break even?
Many scenarios land somewhere between five and ten years. In the example in this article, break-even came in year 9. Lower closing costs, faster rent growth, and stronger appreciation shorten the time. Higher rates and weak appreciation lengthen it.
Is rent really throwing money away?
Not exactly. Rent buys housing, just as owner costs do. Interest, property tax, insurance, and repairs are also money you never get back. The real difference is that part of an owner’s payment builds equity, while a renter’s equivalent is whatever they choose to invest.
What is the 5% rule for rent vs buy?
The 5% rule is a rough screen. It estimates the yearly cost of owning that is not equity, such as property tax, maintenance, and the cost of tied-up cash, at about 5% of the home’s value. If yearly rent is higher than that, buying may be attractive. It is a quick filter, not a full analysis.
Does a bigger down payment change the break-even point?
Yes. A larger down payment lowers your loan and your interest cost, which can shorten break-even. It also ties up more cash that a renter could invest, and it can leave you with a thinner emergency fund. Test several down payment sizes before you decide.
Should I include tax benefits in my comparison?
Only if you know you will qualify. Many owners take the standard deduction, so mortgage interest and property tax may not lower their tax bill. If you itemize, add the real savings from your tax return. A tax professional can tell you what applies to you.
What if I plan to rent out the home later?
Renting out the home changes the math, because rental income, vacancy, management costs, and landlord taxes enter the picture. Run the break-even for the years you will live there, then treat the rental period as a separate investment decision.